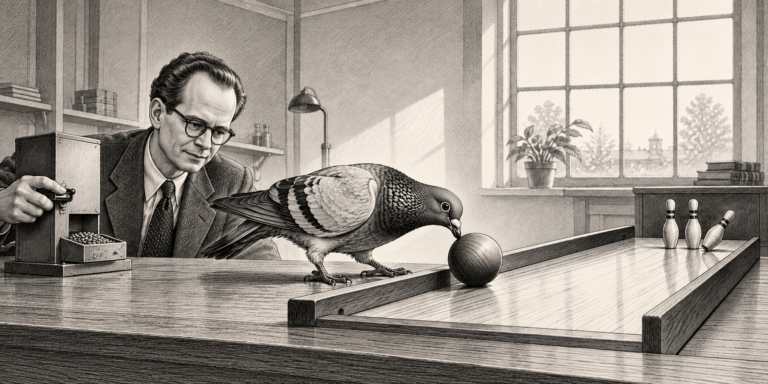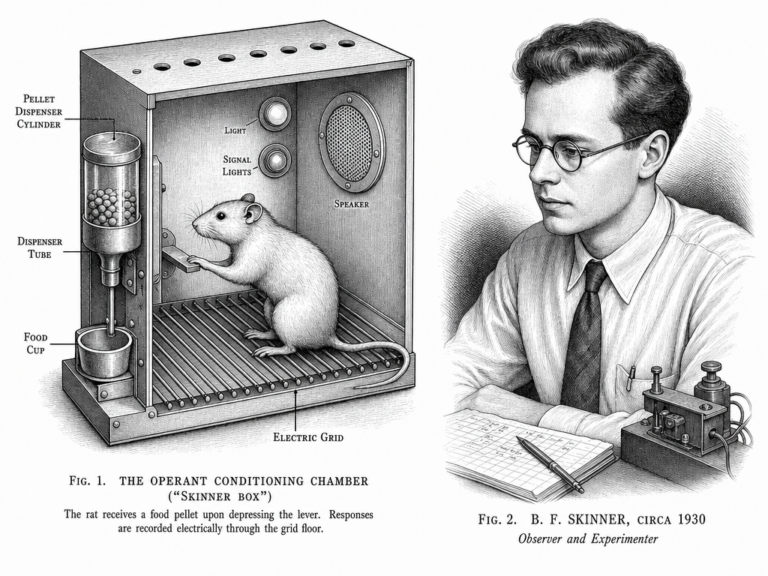
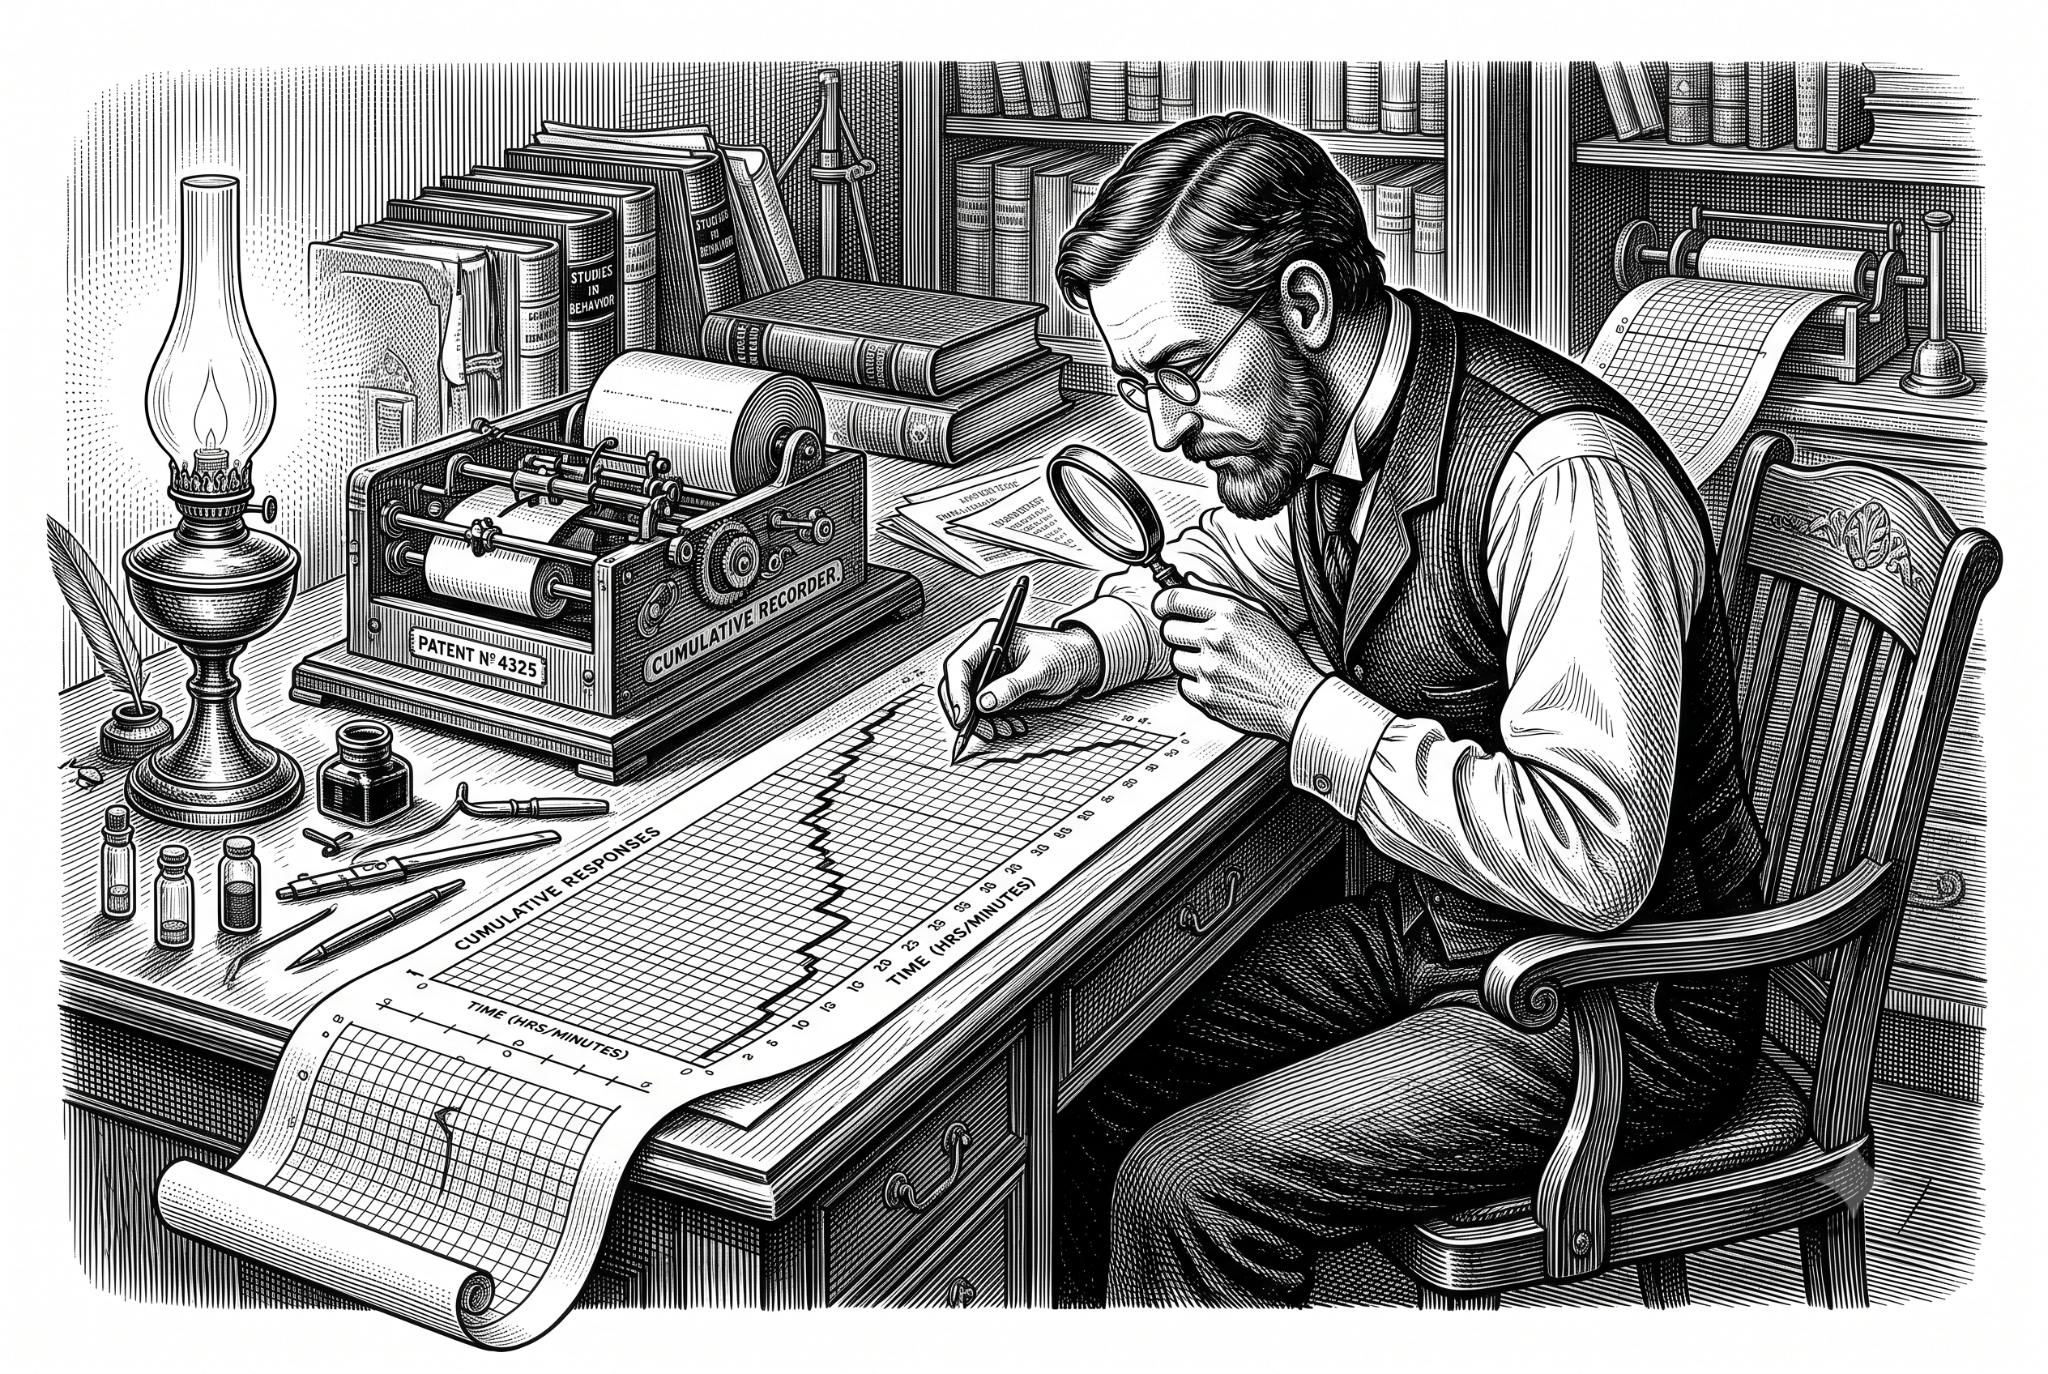
To see if a treatment works, a behavior analyst does not test it on a hundred children and report the average. Instead, she tries it with one child, plots the response data, and reads the graph. This practice began with a slow-moving roll of paper and a pen that Skinner built in the 1930s, the first tool to make behavior rate visible.
How the Recorder Made Rate Visible
The device was simple and mechanical. Skinner adapted the kymograph, a lab tool that slowly pulled paper past a pen. Each response moved the pen up a notch as the paper slid to the side. At any time, the pen’s height showed the total responses since the session started, so the line only went up or stayed flat. A steep line meant fast responses, while a flat part meant a pause. According to Lattal’s 2004 history in the Journal of the Experimental Analysis of Behavior, it was the most widely used measurement tool in experimental behavior analysis from the 1930s until recently, second only to the operant chamber among Skinner’s inventions.
Those rising lines were the data. Skinner and his colleagues used them to see how different reinforcement schedules changed response rates. Rate was the number Skinner focused on, treating it as the true measure of a behavior’s strength.
One Subject, Studied Until Stable
The instrument suggested a new way to do science. If one pen tracing one animal could show how a behavior’s rate changed, then the individual record held the answer. In his 1956 essay “A Case History in Scientific Method” in American Psychologist, Skinner admitted he distrusted what he called “mechanized statistics.” He trusted studying one case closely over time more than relying on group averages.
This preference turned into a method. A single-subject design, or single-case design, studies individuals. A few subjects are kept under the same condition until their behavior stabilizes. This approach is sensitive to individual differences. Group designs focus on averages, and by reporting only means and effect sizes, they can hide the unique details of each person. Single-subject work has been the standard in behavioral psychology since the field began.
Murray Sidman brought discipline to this approach. In his 1960 book “Tactics of Scientific Research,” he described the steady-state strategy: maintain a condition and wait until behavior is steady from one observation to the next before making any changes. Stability comes first. Then, any change after switching conditions is easy to spot because the baseline was steady.
Reading Level, Trend, and Variability
When behavior is shown on a graph, you analyze it by looking at it. Visual analysis is the most recommended method for single-case designs and is standard in ABA. Instead of running a significance test, the analyst looks at the graph: the data level, its trend, how much it varies, how much overlap there is between conditions, and how quickly behavior changes when conditions change. If a treatment works, it usually shows up right away. The line moves as soon as the intervention starts.
Judging a graph by eye is subjective, and different analysts may see things differently. Studies on the reliability of visual inspection have yielded mixed results. Without clear rules, people can interpret the same graph differently. This limitation suggests we should write clear decision rules rather than replace the graph with a significance test.
Lindsley, Precision Teaching, and Frequency
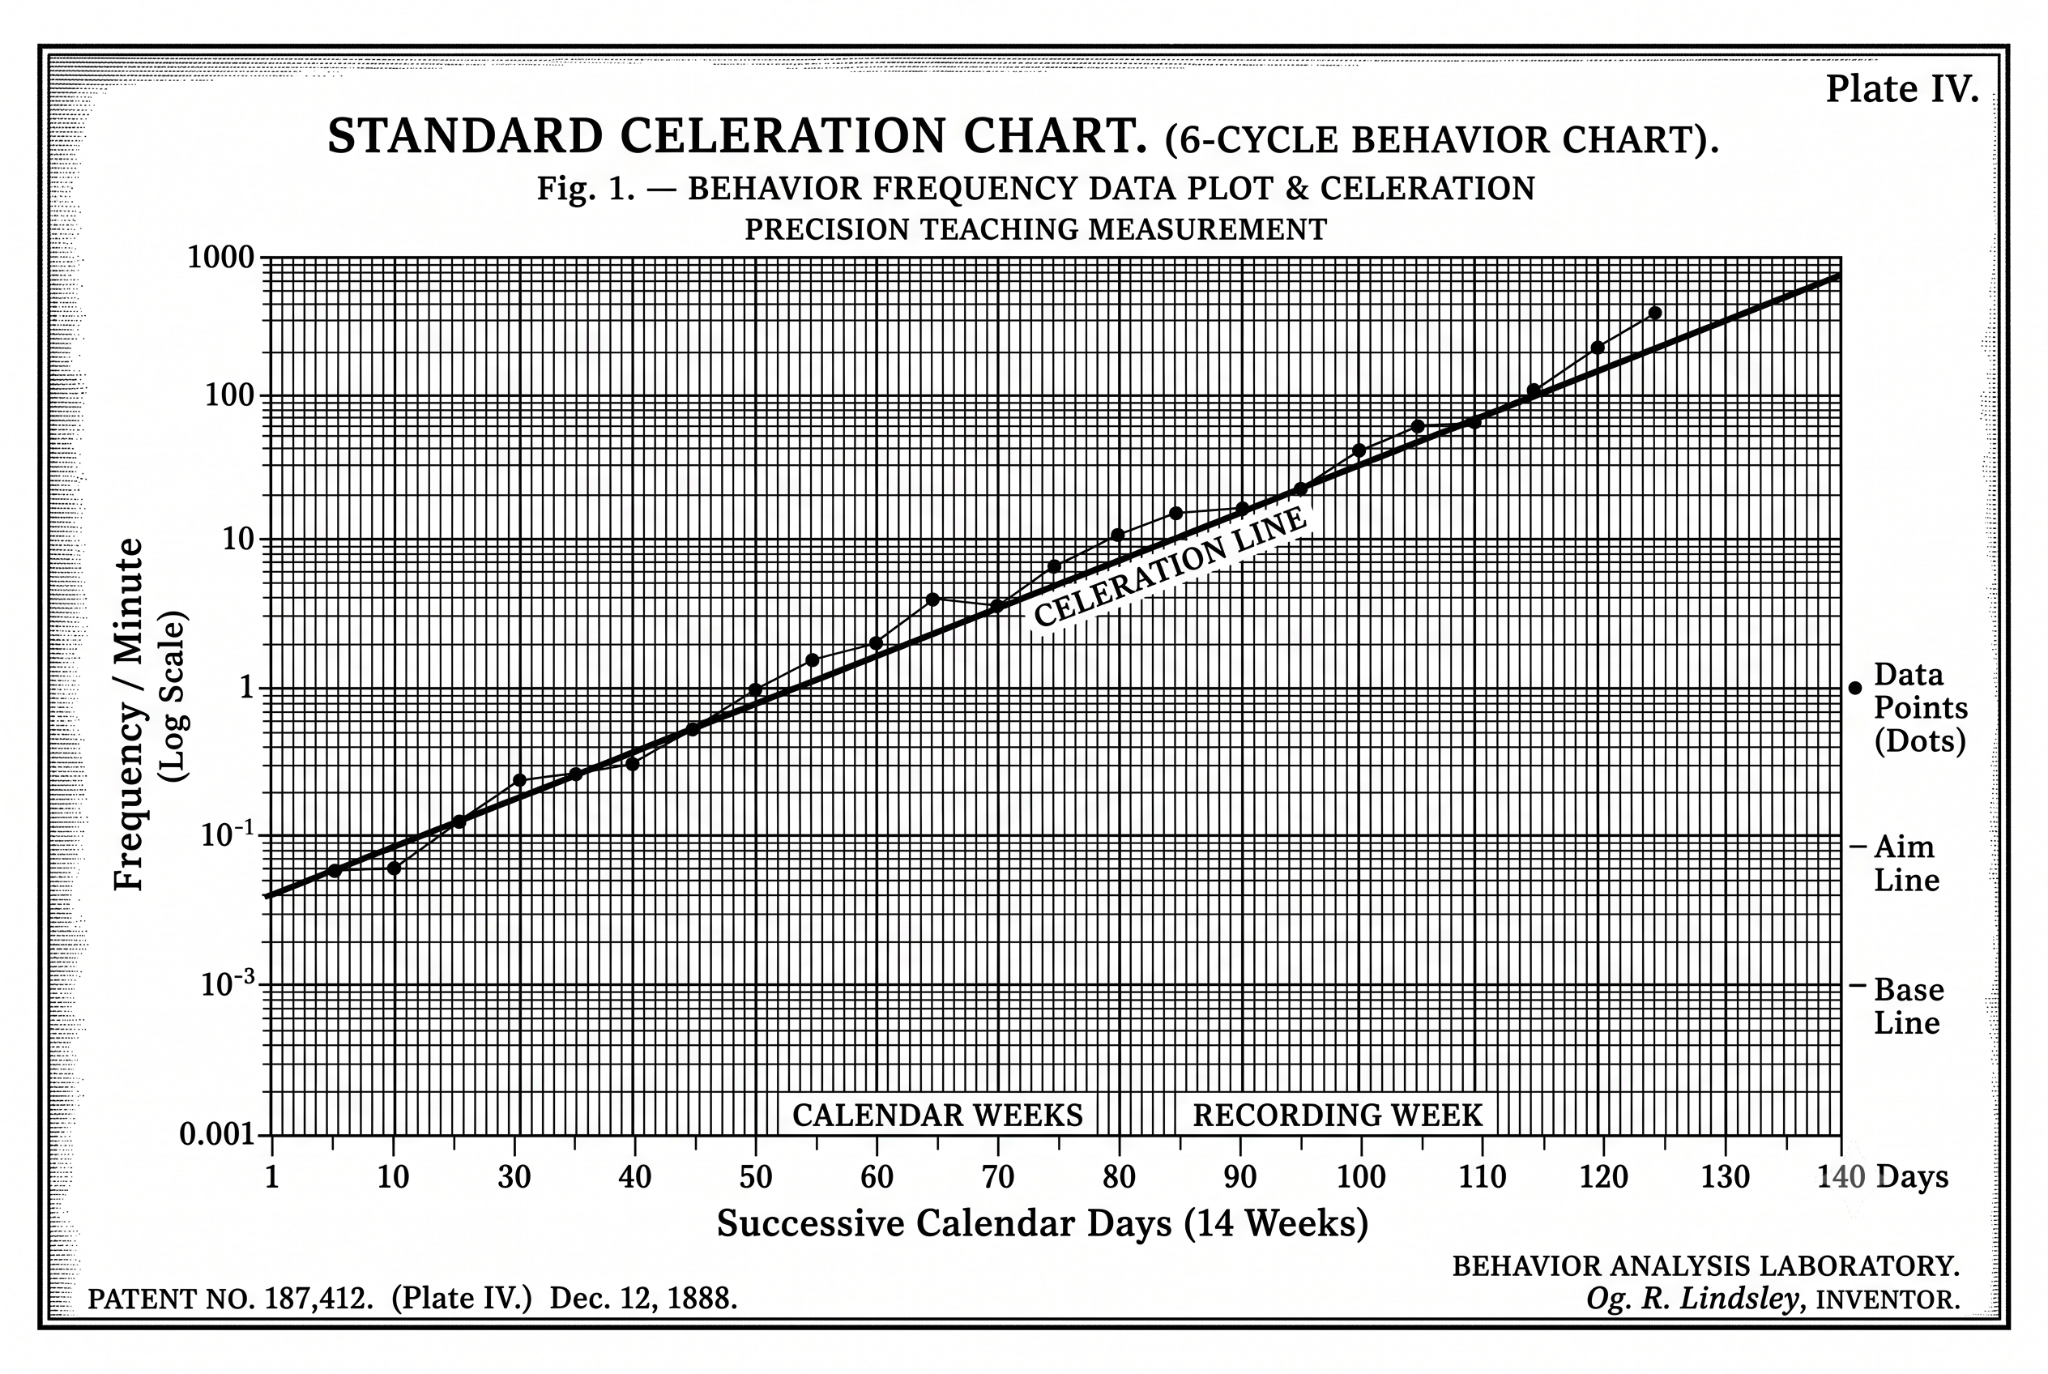
One of Skinner’s students took the idea beyond the lab. Ogden Lindsley studied with Skinner in the 1950s and led the Harvard Behavior Research Laboratory, which was considered the first human operant lab. He kept using Skinner’s measure: frequency, or rate, as his main data point. Lindsley then brought free-operant methods into regular classrooms, calling this approach precision teaching. In free operant learning, the student responds at their own pace, not the teacher’s or the materials’ pace.
In 1965, he created the tool this approach needed: the Standard Celeration Chart. This standardized chart lets people plot the frequency of human behavior over days, weeks, months, and years. It brought together three things: frequency as a standard unit, Skinner’s free-operant behavior, and the logic behind the cumulative recorder.
The results showed up in the numbers. Lindsley and his colleagues found that frequency was 10 to 100 times more sensitive than percent correct in detecting the effects of drugs and reinforcers. In academic settings, frequency counts found about 40 times as many effects from curriculum changes as percent-correct did. Rate detected changes that percent-correct missed.
What a BCBA Does Now
This approach moved directly into clinical practice. Applied behavior analysis became a profession in the late 1960s, and the Journal of Applied Behavior Analysis started publishing in 1968. The habit of measuring was already in place. Today, a board-certified behavior analyst does with a client what Skinner did with a single record. She defines a target behavior, counts it, plots it session by session, and decides if treatment is working by looking at the graph. The comparison is the client against herself over time, not against a group average. The same features Sidman and Lindsley focused on—the level of the line, its slope, and how much it varies—are what clinicians check before keeping or changing a program.
Turn behavior into a line on a page, and you no longer need a crowd to prove it changed. One client measured against herself over time is the entire experiment.
That is why ABA sessions produce data. The graph is not just paperwork; it is the experiment itself, run one client at a time. The analyst reads the rate from the page just as Skinner did from his machine. This is the main point: ABA measures change by watching the individual record.
AT A GLANCE
| Instrument: | Cumulative recorder, adapted by Skinner from the kymograph in the 1930s |
| How it worked: | Each response moved the pen up one notch as paper slid sideways; a steep slope meant fast responding, a flat line a pause |
| Reach: | The most widely used measurement instrument in the experimental analysis of behavior, from the 1930s to recent times (Lattal, 2004) |
| Skinner’s key measure: | Rate of responding, treated as the real index of a behavior’s strength |
| Skinner’s 1956 essay: | “A Case History in Scientific Method,” where he voiced distrust of “mechanized statistics” |
| Single-subject design: | A few subjects, each studied until the measure is stable; sensitive to the individual, not the group mean |
| Steady-state strategy: | From Murray Sidman’s 1960 “Tactics of Scientific Research”; wait for stable behavior before changing conditions |
| Visual analysis: | Reading level, trend, variability, overlap, and immediacy off the graph instead of running a significance test |
| Honest caveat: | Reliability studies of visual inspection are mixed; without explicit rules, reads can vary by analyst |
| Precision teaching: | Ogden Lindsley’s classroom method built on frequency; he studied under Skinner in the 1950s |
| Standard Celeration Chart: | Built by Lindsley in 1965 to plot frequency over days, weeks, months, and years |
| Sensitivity finding: | Frequency ran 10 to 100 times more sensitive than percent-correct, and about 40 times for curricular changes |
SOURCES & REFERENCES
| 1. | Lattal KA. “Steps and Pips in the History of the Cumulative Recorder.” Journal of the Experimental Analysis of Behavior. 2004;82(3):329–347. https://pmc.ncbi.nlm.nih.gov/articles/PMC1285015/ |
| 2. | Skinner BF. “A Case History in Scientific Method.” American Psychologist. 1956;11:221–233. |
| 3. | Sidman M. Tactics of Scientific Research: Evaluating Experimental Data in Psychology. New York: Basic Books; 1960. |
| 4. | Wikipedia. “Single-subject design.” https://en.wikipedia.org/wiki/Single-subject_design |
| 5. | Comparing Visual and Statistical Analysis in Single-Case Studies. PubMed Central, PMC4677800. https://pmc.ncbi.nlm.nih.gov/articles/PMC4677800/ |
| 6. | Athabasca University. “A Brief History: Ogden Lindsley and Precision Teaching.” https://psych.athabascau.ca/open/lindsley/history.php |
| 7. | Wikipedia. “Precision teaching.” https://en.wikipedia.org/wiki/Precision_teaching |
| 8. | Baer DM, Wolf MM, Risley TR. “Some Current Dimensions of Applied Behavior Analysis.” Journal of Applied Behavior Analysis. 1968;1(1):91–97. |