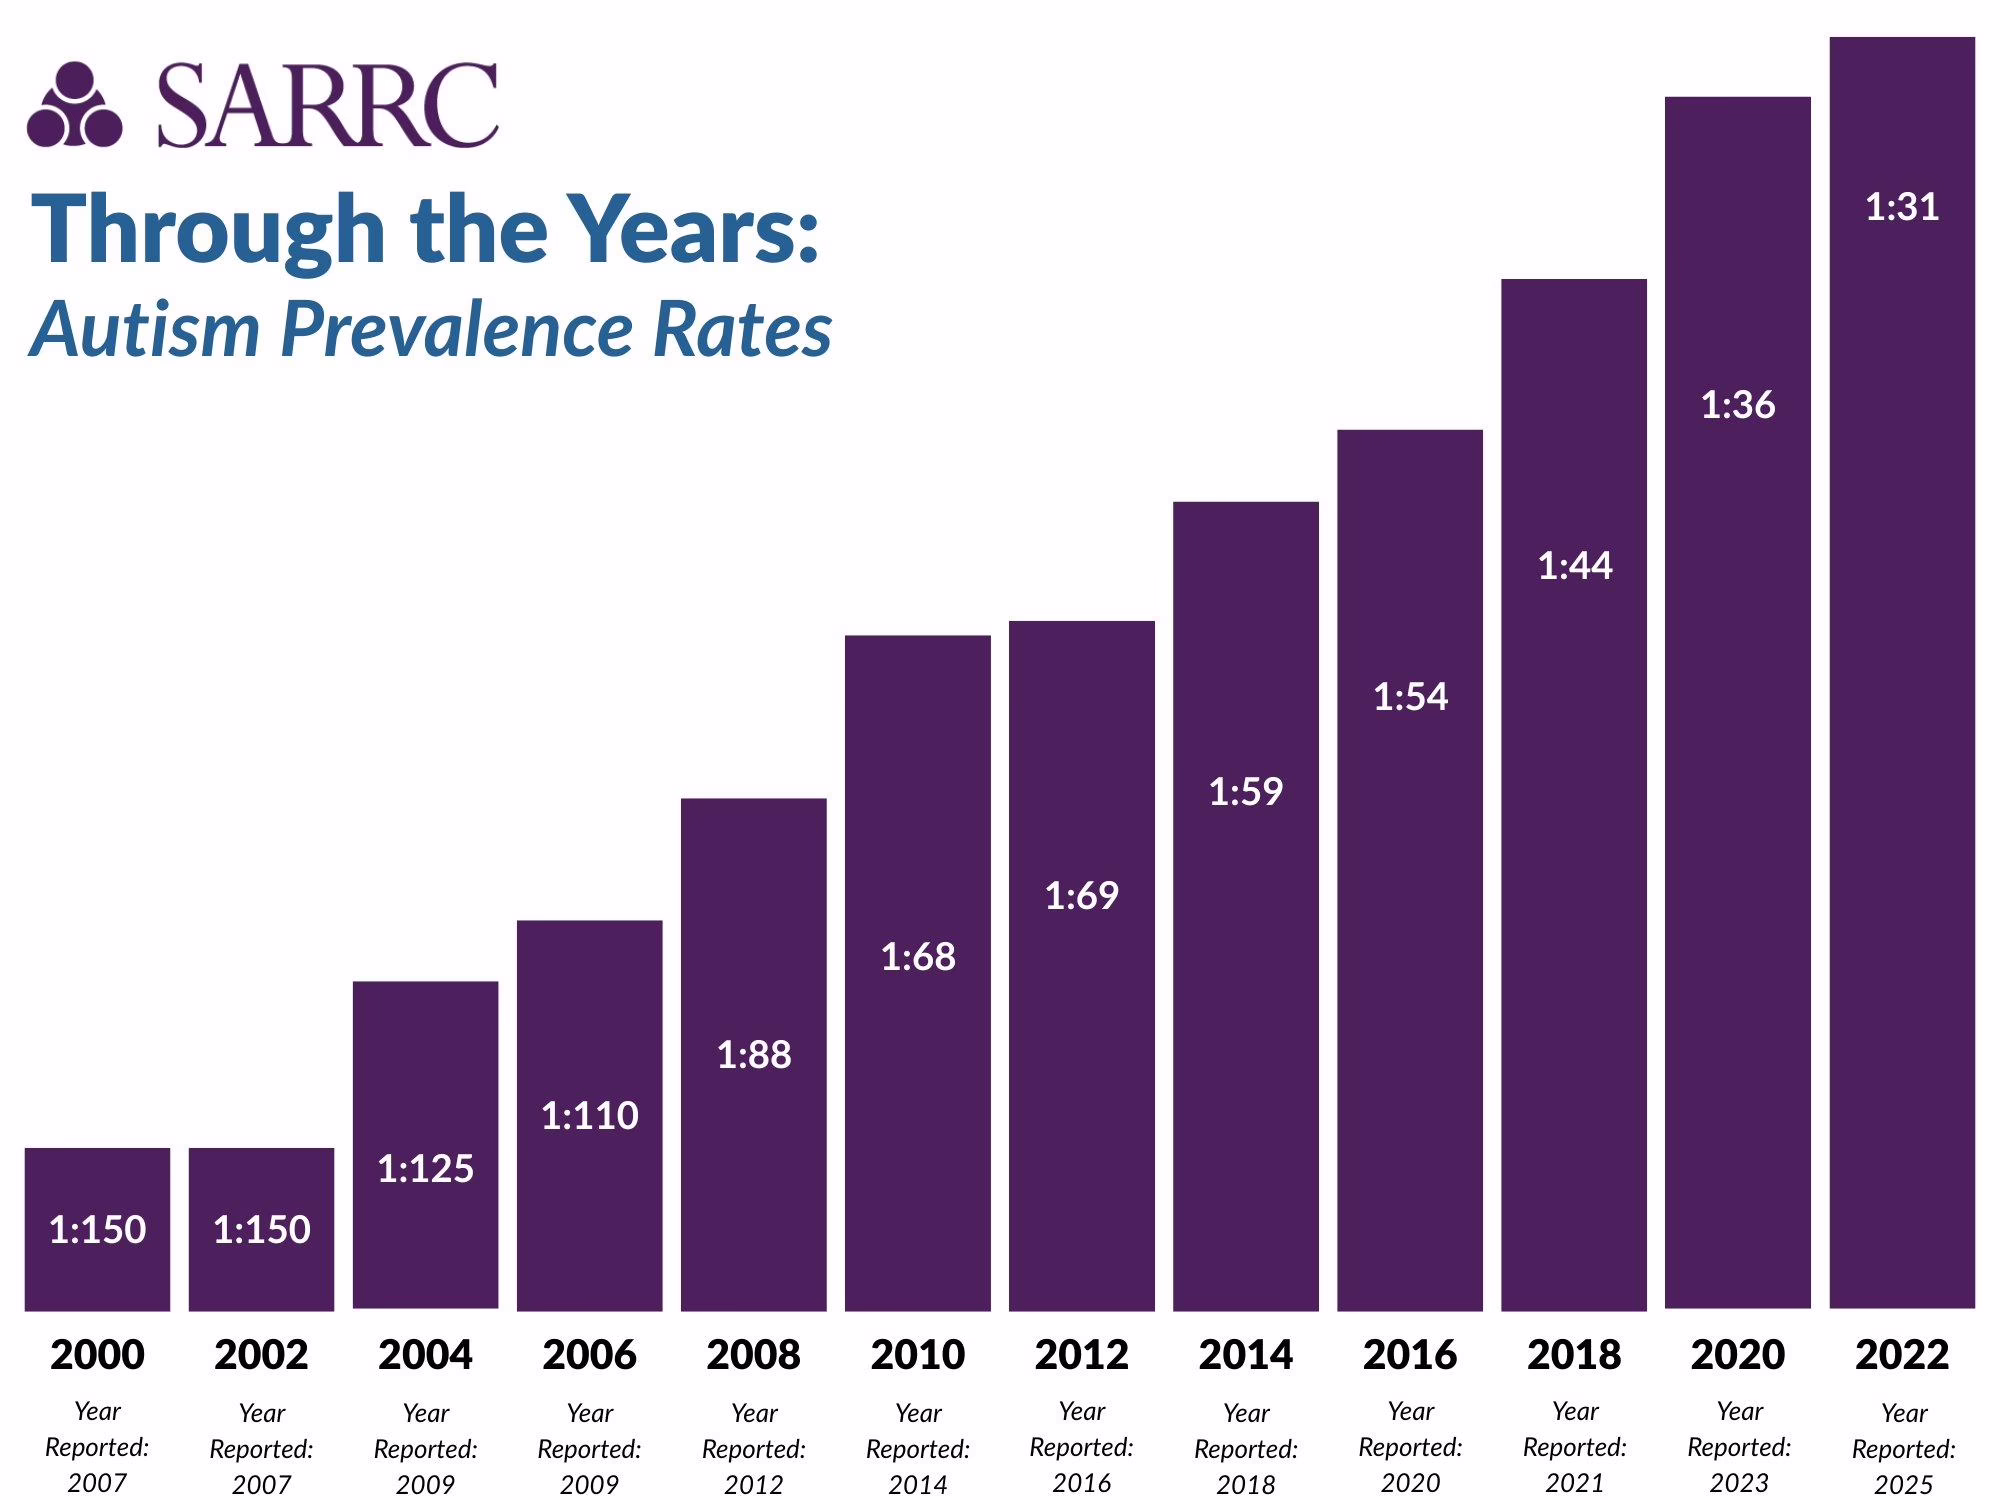
The Report: 1 in 31 Eight-Year-Olds Identified With Autism
WASHINGTON, D.C. — on April 15, 2025, the Centers for Disease Control and Prevention published updated autism prevalence data in its Morbidity and Mortality Weekly Report. The report, authored by Kelly Shaw and colleagues at the ADDM Network across 16 surveillance sites in 14 states, found that approximately 1 in 31 eight-year-old children in the United States had been identified with autism spectrum disorder in 2022. This represents a continued upward trajectory from the prior estimate of 1 in 36 based on 2020 data, and approximately a 22 percent increase over two years.
The prevalence data are derived from health and educational records for children at ages 4 and 8 at 16 sites located in Arizona, Arkansas, California, Georgia, Indiana, Maryland, Minnesota, Missouri, New Jersey, Pennsylvania, Puerto Rico, Tennessee, Texas (Austin and Laredo), Utah, and Wisconsin. The ADDM Network has conducted biennial surveillance since 2000, when the estimated prevalence was 1 in 150. The trajectory from 1 in 150 to 1 in 31 over two decades represents a nearly fivefold increase.
HHS Secretary Robert F. Kennedy Jr. characterized the findings in stark terms, stating that prevalence among boys was 1 in 20 and that California’s rate had reached 1 in 12.5. The CDC report confirmed that ASD prevalence ranged from 14.6 per 1,000 children in Texas (Laredo) to 53.1 per 1,000 in California. Boys were 3.4 times more likely than girls to be identified with autism, a ratio that narrowed slightly from 4.2 in 2018.
From 1 in 150 in 2000 to 1 in 31 in 2022 — the trajectory of U.S. autism prevalence over two decades has reshaped every financial model in the ABA industry, from PE investment theses to state Medicaid budget projections.
Demographic Shifts: Minority Children Now Identified at Higher Rates
One of the most significant findings in the 2025 report is the reversal of a longstanding demographic pattern. For the first time in years of ADDM data collection, non-white children were identified with autism at higher rates than white children. Among 8-year-olds, Black children had a prevalence of 3.66 percent, Asian children 3.82 percent, and Hispanic children 3.30 percent, compared to 2.77 percent among white children.
The CDC attributed this shift to increased access to identification services among previously underserved communities and expanded use of educational records in addition to health records for surveillance. The implication is that the overall prevalence increase reflects, at least in part, the identification of children who would have been missed by earlier, narrower surveillance methodologies.
Among 4-year-olds born in 2018, the overall prevalence was 2.93 percent (1 in 34), and early diagnoses had increased substantially. Children born in 2018 were 1.7 times more likely to have been diagnosed before 48 months compared to those born in 2014. This trend toward earlier identification has direct implications for ABA service demand, as earlier diagnosis typically leads to earlier treatment initiation and longer treatment duration.
What the Number Means for Medicaid Budgets
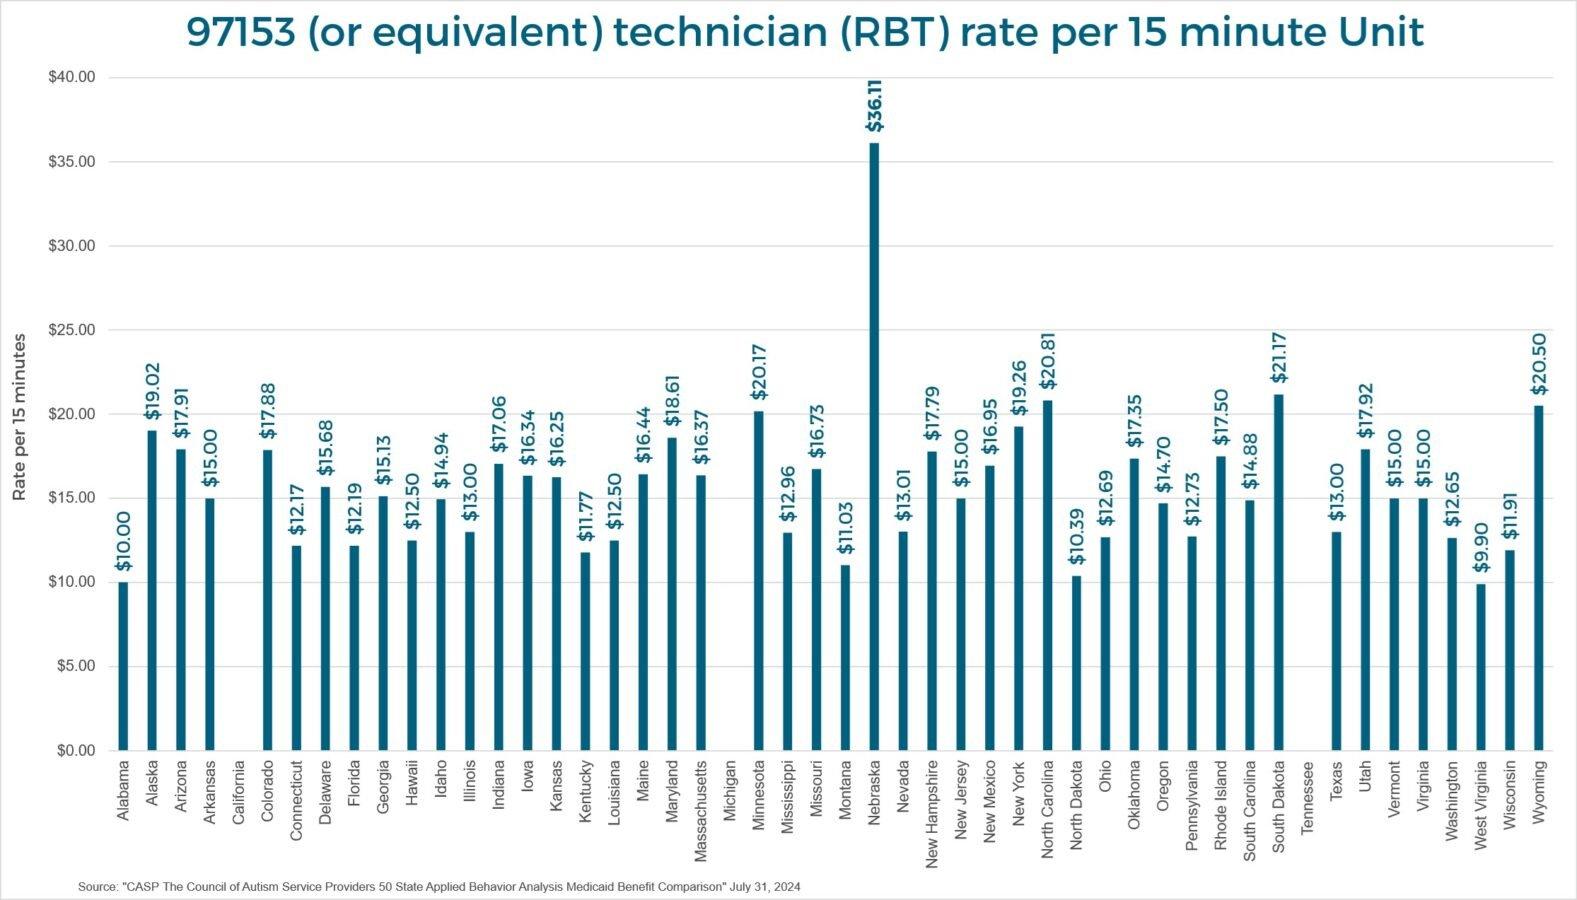
Rising autism prevalence directly increases the number of children eligible for Medicaid-funded ABA services, amplifying state budget pressures that are already acute in many states.
The prevalence update has immediate budget implications for state Medicaid programs. Higher prevalence means more children eligible for ABA services, which translates directly into higher Medicaid expenditures. The relationship is not linear — it is amplified by the combination of increasing prevalence, earlier diagnosis leading to earlier and longer treatment, and expanding insurance mandates that require coverage of ABA services.
The scale of Medicaid ABA spending growth has already drawn federal attention. Nationally, Medicaid spending on ABA increased 298 percent between 2014 and 2024, from 7 million hours of therapy to 25 million hours per year, according to Trilliant Health. Individual states have seen even more dramatic trajectories: Indiana’s ABA spending rose from $21 million in 2017 to $611 million by 2023; Colorado’s went from $60.1 million to $163.5 million; Nebraska’s surged from $4.6 million to over $83 million.
Each percentage point increase in autism prevalence feeds directly into these spending trajectories. If prevalence continues to rise at the rate observed between 2020 and 2022, the 1 in 31 figure will itself be superseded within two years, and Medicaid budget projections that were built on the 1 in 36 estimate will require upward revision.
What the Number Means for Private Equity Investment Theses
For private equity firms invested in ABA platforms, the prevalence update validates the fundamental demand thesis. The ABA therapy market’s total addressable market is estimated between $50 billion and $70 billion, with current penetration estimated at roughly $7 billion. Rising prevalence increases the numerator in every TAM calculation, reinforcing the narrative that the market remains early in its growth trajectory despite the PE capital already deployed.
At the 2024 Autism Investor Summit, multiple banking and finance professionals noted that autism platforms currently command the highest valuations within behavioral health, with well-run assets seeing multiples in the mid-to-high teens of EBITDA. The prevalence update strengthens the case for sustained premium valuations by reinforcing the long-term demand outlook.
However, the prevalence data also amplify the fraud risk calculus. Higher prevalence means more Medicaid-funded patients, more billable hours, more providers entering the market, and more opportunities for the documentation failures and billing irregularities that the HHS-OIG has identified in every state it has audited. For PE investors, the prevalence update is simultaneously a growth opportunity and a compliance risk multiplier.
What the Number Does Not Mean
The prevalence increase does not necessarily reflect a true increase in the incidence of autism. The CDC and independent researchers have consistently noted that improved screening, broader diagnostic criteria, expanded use of educational records, and increased public awareness all contribute to higher identification rates. The 2025 report explicitly attributes some of the increase to progress in reaching historically underserved communities.
Dr. Zachary Warren, one of the report’s lead authors, stated that the most compelling finding was how incredibly common the presentation of autism is. This framing emphasizes identification rather than causation — the surveillance network is getting better at counting, and the number it is counting is larger than previously estimated. The distinction matters for policy: a true incidence increase would suggest environmental or genetic factors driving new cases, while improved identification suggests that the population has always been larger than measured.
AT A GLANCE
| CDC report date: | April 15, 2025 (MMWR Surveillance Summary, Vol. 74, No. SS-2) |
|---|---|
| Prevalence (8-year-olds): | 1 in 31 (3.23%) based on 2022 data |
| Prior estimate: | 1 in 36 (2.78%) based on 2020 data |
| Change: | ~22% increase over two years; ~5x increase since 2000 (1 in 150) |
| Gender ratio: | Boys 1 in 20; girls 1 in 88; male-to-female ratio 3.4:1 |
| Geographic range: | 14.6/1,000 in Texas (Laredo) to 53.1/1,000 in California |
| Racial shift: | Non-white children identified at higher rates than white children for first time |
| ADDM sites: | 16 sites in 14 states |
| Early identification: | Children born in 2018 were 1.7x more likely to be diagnosed before age 4 vs. 2014 |
| ABA market TAM: | $50–$70 billion estimated; ~$7 billion current penetration |
SOURCES & REFERENCES
| 1. | Shaw KA, Williams S, Patrick ME, et al. “Prevalence and Early Identification of Autism Spectrum Disorder Among Children Aged 4 and 8 Years — ADDM Network, 16 Sites, United States, 2022.” MMWR Surveill Summ 2025;74(SS-2):1–22. doi: 10.15585/mmwr.ss7402a1 |
|---|---|
| 2. | HHS Press Room. “Autism Epidemic Runs Rampant, New Data Shows 1 in 31 Children.” April 15, 2025. hhs.gov/press-room |
| 3. | IBCCES. “The CDC Raises the Autism Diagnosis Rate to 1 in 31 Children in the US.” April 17, 2025. ibcces.org |
| 4. | Autism Research Institute. “2022 Surveillance Data Suggests 1 in 31 Identified as Autistic.” April 16, 2025. autism.org/prevalence2025 |
| 5. | SARRC. “CDC Releases New Autism Prevalence: 1 in 31 Children in the U.S. Identified with Autism.” April 16, 2025. autismcenter.org |
| 6. | Behavioral Health Business. “New Autism Deals Needed to Redefine Valuation Standards.” May 6, 2024. bhbusiness.com |
| 7. | Trilliant Health. ABA therapy utilization data cited in New York Post / Maine Today. March 2026. |