The Scale of the California Market
SACRAMENTO, CALIFORNIA – No state comes close to California’s combination of ABA market size, autism prevalence, and regulatory density. The CDC’s Autism and Developmental Disabilities Monitoring Network reported that California recorded the highest ASD prevalence of any monitoring site in its 2020 surveillance year: 44.9 per 1,000 children aged 8, compared to a national average across sites of approximately 27.6 per 1,000. One source estimates that roughly 1 in 27 California children carries an ASD diagnosis. The state’s Department of Developmental Services, which administers the Lanterman Act through 21 regional centers, reported that its autism caseload exceeded 177,400 individuals in 2023 — an all-time high, representing 156 percent growth over the preceding decade.
The workforce numbers reinforce California’s dominance. The Behavior Analyst Certification Board’s 2025 employment demand report, produced in partnership with the labor analytics firm Lightcast, recorded 132,307 unduplicated BCBA and BCBA-D job postings nationally in 2025 — a 28 percent increase over the prior year. California alone accounted for approximately 15 percent of that demand, the highest share of any state. In 2023, when BACB last provided state-level breakdowns at that detail, California represented 18 percent of all BCBA job postings. The five leading states — California, New Jersey, Texas, Massachusetts, and North Carolina — collectively accounted for 38 percent of all 2025 demand.
The supply side lags dramatically. As of mid-2025, there were approximately 48,352 BCBA certificants and 186,880 Registered Behavior Technicians nationally. With roughly 50,000 fewer BCBAs than job openings, the national workforce gap is severe — and in California, where cost of living strains retention and the caseload is the nation’s largest, the gap is particularly acute.
California recorded the highest ASD prevalence of any CDC monitoring site in 2020 at 44.9 per 1,000 children aged 8. Its DDS autism caseload exceeded 177,400 in 2023, representing 156 percent growth over the previous decade.
The Regulatory Architecture: A Three-Layer System Unlike Any Other State
California’s ABA regulatory environment is not merely complex — it is structurally unique. No other state runs a three-layer system in which private insurance mandates, a Medicaid managed care program, and a statewide developmental services apparatus all intersect, overlap, and in some cases conflict on the question of who pays for ABA.
Layer 1 — Private Insurance (SB 946): Senate Bill 946, signed by Governor Brown in October 2011 and effective July 1, 2012, requires every health care service plan contract and health insurance policy providing hospital, medical, or surgical coverage to also provide coverage for behavioral health treatment for autism or pervasive developmental disorder. This includes ABA therapy. The law applies to fully insured plans regulated by either the Department of Managed Health Care (DMHC) or the California Department of Insurance (CDI). It does not apply to self-funded employer plans governed by ERISA, nor does it apply to Medi-Cal. The CDI has initiated enforcement actions against multiple insurers — including Blue Shield, Health Net, Cigna, UnitedHealthcare, and Anthem — to compel compliance. An additional protection took effect January 1, 2026 under AB 951: state-regulated plans can no longer require a re-diagnosis of autism as a condition for continued behavioral health treatment coverage.
Layer 2 — Medi-Cal Managed Care (BHT Benefit): Medi-Cal, California’s Medicaid program, covers approximately 40 percent of the state’s population. ABA therapy is covered under the Behavioral Health Treatment benefit for Medi-Cal members under age 21 when a physician or psychologist deems it medically necessary. However, providers do not bill the state directly. Claims go to managed care plans — CalOptima in Orange County, Inland Empire Health Plan (IEHP) in San Bernardino and Riverside, L.A. Care in Los Angeles, Blue Shield Promise, Anthem, and others — each of which operates under its own authorization workflows, documentation standards, and audit practices. As of May 2025, California also launched the PAVE enrollment portal, requiring ABA providers to enroll in the Medi-Cal fee-for-service system, with some managed care organizations requiring this enrollment as a condition of network participation.
Layer 3 — Regional Centers (Lanterman Act): The Department of Developmental Services oversees 21 regional centers, which serve as the state’s community-based system for people with developmental disabilities under the Lanterman Developmental Disabilities Services Act. Regional centers are designated as payers of last resort: they will fund ABA services only after a family has pursued and been denied coverage through private insurance or Medi-Cal. They can also cover co-pays and deductibles for families earning below 400 percent of the Federal Poverty Level. Each regional center operates under its own board of directors and maintains its own vendor relationships, creating significant variation in access and service authorization practices across the state’s 21 catchment areas.
No other state runs a three-layer system in which private insurance mandates, a Medicaid managed care program, and a statewide developmental services apparatus all intersect on the question of who pays for ABA.
The Medi-Cal Maze: Plan-Level Variation as the Core Operating Challenge
For ABA providers serving Medi-Cal populations, the most immediate operational challenge is not the state’s regulations themselves but the plan-level variation in how those regulations are administered. Each managed care plan maintains its own rules for prior authorization, reauthorization timelines, documentation requirements, and audit triggers. Providers operating across multiple counties must maintain parallel compliance workflows for each plan.
CalOptima (Orange County): Denials frequently stem from missing modifiers, incomplete reauthorization submissions, or missed renewal deadlines. CalOptima’s BHT workflows have been described by billing specialists as prone to breakdowns at the authorization, claim submission, and IPA routing stages.
Blue Shield Promise: Known for heavier documentation scrutiny, particularly on post-payment audits. Providers report that even when initial authorization is approved, claims are subsequently reviewed for alignment between session notes, treatment plans, and billed CPT codes. Billing CPT 97155 (adaptive behavior treatment with protocol modification) without clear documentation of how the protocol was analyzed or modified is a commonly cited recoupment trigger.
L.A. Care: Authorization delays are a recurring theme, with providers reporting stalled submissions that create gaps in care continuity.
IEHP (Inland Empire): Claim rejections occur when the payer is misidentified as the plan rather than a delegated Independent Practice Association, a structural distinction that can result in timely filing failures if not caught early.
A July 2023 Office of Inspector General report found that prior authorization denial rates for Medicaid managed care plans nationally were 12.5 percent, more than double the 5.7 percent rate for Medicare Advantage plans. In California, where the managed care architecture is among the most fragmented in the country, providers face these denial dynamics multiplied across dozens of plan-specific workflows.
The DDS Budget and the Proposition 35 Landscape
The fiscal context for California’s ABA market is defined by two massive spending systems operating in parallel. The DDS budget for fiscal year 2024–25 reached $15.9 billion from all fund sources, of which $15.4 billion funded the regional center system. That represented a 17.8 percent increase over the prior year. General Fund spending within DDS rose 28 percent year over year, driven by caseload growth, changes in service utilization, and scheduled minimum wage increases affecting direct service professionals. DDS serves over 500,000 Californians with developmental disabilities — and autism is the fastest-growing diagnostic category, comprising an increasing share of the Lanterman-eligible caseload.
On the Medi-Cal side, Proposition 35, approved by California voters in November 2024, made permanent the Managed Care Organization Provider Tax — a levy on health plans that generates between $7 billion and $8 billion annually for the state. The measure requires the state to direct more of this revenue toward provider rate increases and program augmentations rather than using it to offset existing General Fund spending. Under Proposition 35, the state must spend $300 million each in 2025 and 2026 on behavioral health-related services. Total Medi-Cal spending across all fund sources reached $197 billion in 2025–26. However, whether ABA-specific Medi-Cal rates will see meaningful increases remains an open question, as the Proposition 35 spending plan has prioritized primary care, emergency services, and hospital payments in its initial implementation.

The Provider Landscape: Scale, Fragmentation, and PE Consolidation
California’s ABA provider market reflects the broader national pattern of high fragmentation alongside aggressive private equity consolidation. The ABA market nationally remains highly fragmented — the top 10 players account for only an estimated 10 to 15 percent of total market share. In California, the landscape includes both legacy clinical organizations with decades of experience and newer PE-backed platforms pursuing rapid geographic expansion.
360 Behavioral Health: Established in 2018 as an umbrella brand consolidating multiple California-based service lines, 360 Behavioral Health is among the state’s largest and longest-tenured ABA providers, with more than 30 years of combined organizational history. The company provides services across home, school, clinic, and telehealth settings.
ACES (Autism Comprehensive Educational Services): One of the largest providers on the West Coast, ACES operates learning centers, in-home programs, and school-based services. Founded by a teacher, the organization works with more than 100 insurance plans across California and other states.
Cortica: A transdisciplinary healthcare company that integrates pediatric neurology, developmental therapies, and ABA under one clinical model. Cortica operates multiple locations across California, including San Diego, Torrance, Concord, and Marin County. The company has positioned itself around a whole-child approach that pairs ABA with medical oversight.
Other significant California providers: Autism Learning Partners, LEARN Behavioral (with more than 17 California locations), Kyo, Behavior Frontiers, and Trumpet Behavioral Health (now part of BlueSprig) all maintain substantial California footprints. The state also has hundreds of smaller independent practices, many of which serve regional center or Medi-Cal populations exclusively.
The competitive dynamics are shaped by California’s cost structure. The state’s high cost of living, particularly in the Bay Area and Los Angeles metro, drives up wages for RBTs and BCBAs without corresponding increases in payer rates. Providers report that Medi-Cal reimbursement rates have not kept pace with wage inflation, creating margin compression that disproportionately affects organizations serving publicly insured populations.
Workforce Pressure: The California BCBA Gap
The BCBA workforce shortage is a national crisis, but California experiences it at a scale that compounds every other market challenge. The BACB’s 2025 data showed that nationally, there were roughly 81,566 board certified behavior analysts against 132,307 job postings — a gap of approximately 50,000. California, accounting for 15 percent of that demand, faces a proportional shortfall of several thousand BCBAs.
The structural factors are reinforcing. California’s high housing and living costs make it difficult to recruit and retain BCBAs compared to lower-cost states. Entry-level RBT positions, which form the backbone of direct ABA service delivery, compete for labor against retail, hospitality, and other sectors that have raised wages significantly in recent years. California’s statewide minimum wage of $16 per hour (effective January 1, 2024) sets a floor that pushes RBT wages higher — but payer rates have not adjusted proportionally.
The BACB reported that 44 percent of all current BCBAs earned their certifications within the last five years. This young workforce creates a dual challenge: a shortage of experienced clinical supervisors to oversee treatment plans and high turnover as early-career BCBAs navigate burnout in high-caseload environments. For California providers, clinician turnover is not merely an HR problem — it is a clinical continuity problem and a revenue problem, as the loss of a supervising BCBA can trigger a cascade of service disruptions for every client on that analyst’s caseload.
California accounts for approximately 15 percent of all national BCBA demand. Its high cost of living, wage competition from other sectors, and Medi-Cal rate compression create a workforce retention challenge that no other state faces at the same scale.
The Federal Medicaid Threat: What Federal Funding Cuts Would Mean for California
The national Medicaid debate introduces an additional layer of uncertainty for California’s ABA market. Federal proposals to reduce Medicaid spending have raised alarms across the state’s health care system. Medi-Cal covers approximately 15 million Californians — roughly 40 percent of the state’s population — and any reduction in the federal match rate or structural changes to Medicaid financing would have outsized consequences for a state with this level of public insurance dependency.
Industry analysts have estimated that proposed federal Medicaid cuts could reduce California’s federal funding by $10 billion to $20 billion, with potential losses of up to 217,000 healthcare jobs and a $37 billion reduction in state economic output. For ABA providers, the risk is both direct — through reduced Medi-Cal reimbursements or tightened eligibility — and indirect, through increased competition as families shift toward private pay and away from publicly funded services. The concurrent pressure from state-level Medi-Cal rate stagnation and potential federal funding reductions places California’s ABA infrastructure under a degree of fiscal stress that is without precedent.
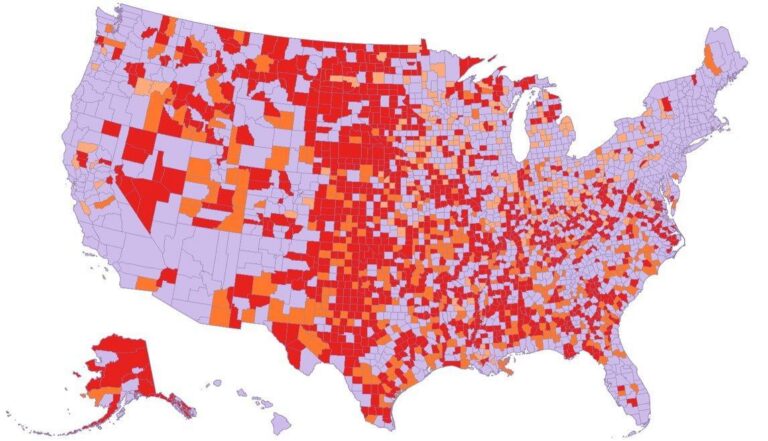
What the Market Map Reveals
California’s ABA market is defined by a paradox: the state has the highest demand, the most comprehensive legal protections, and the most developed service infrastructure in the country, yet its providers face the most complex operating environment in the industry. The three-layer payer system creates administrative burden that smaller practices struggle to absorb. The managed care plan fragmentation means that scaling across counties requires building parallel compliance operations. The workforce shortage constrains growth even when demand and authorization are present. And the state’s cost structure erodes margins for providers whose revenue is largely determined by payer rates that have not kept pace with expenses.
For national platforms considering California entry, the market represents both the largest addressable population and the steepest learning curve. For independent California practices, the challenge is sustainability — maintaining clinical quality and financial viability in an environment where every claim involves navigating a plan-specific maze of authorization, documentation, and audit requirements. For families, the promise of SB 946 and the Medi-Cal BHT benefit exists alongside the reality of waitlists, authorization delays, and provider turnover.
California’s ABA market is not merely the largest in the world. It is the industry’s most demanding test of whether the operational infrastructure of autism care can keep pace with the clinical need.
AT A GLANCE
ASD prevalence (CDC ADDM 2020): 44.9 per 1,000 children aged 8 in California — highest of any monitoring site (CDC, 2023)
DDS autism caseload: More than 177,400 individuals in 2023, a 156% increase over the prior decade (DDS Annual Report, 2024)
DDS total budget (FY 2024–25): $15.9 billion, of which $15.4 billion for regional centers (CA Legislative Analyst’s Office, 2024)
California share of BCBA demand: ~15% of national BCBA job postings in 2025; 18% in 2023 (BACB/Lightcast, 2025 and 2024)
National BCBA job postings (2025): 132,307 unduplicated postings, a 28% year-over-year increase (BACB/Lightcast, 2026)
SB 946 (insurance mandate): Effective July 1, 2012. Requires coverage of BHT including ABA for autism on all fully insured plans.
AB 951 (re-diagnosis protection): Effective January 1, 2026. Prohibits plans from requiring re-diagnosis as condition for continued BHT.
Medi-Cal coverage: ~40% of Californians. ABA covered under BHT benefit for members under 21 via managed care plans.
Regional centers: 21 nonprofit agencies under DDS/Lanterman Act. Payer of last resort for ABA services.
Proposition 35 (Nov 2024): Makes MCO tax permanent. Requires $300M in behavioral health spending in each of 2025 and 2026.
PAVE enrollment: Launched May 2025. ABA providers must enroll in Medi-Cal FFS; some MCOs require it for network status.
Key challenge: Plan-level variation in managed care authorization, documentation, and audit practices across counties.
SOURCES & REFERENCES
1. – CDC. Prevalence and Characteristics of Autism Spectrum Disorder Among Children Aged 8 Years — ADDM Network, 11 Sites, United States, 2020. MMWR. 2023;72(SS-2). https://www.cdc.gov/mmwr/volumes/72/ss/ss7202a1.htm
2. – California Department of Developmental Services. Annual Report to the Legislature on Autism. August 2024. https://www.dds.ca.gov/wp-content/uploads/2024/08/Annual_Report_Legislature_Autism.pdf
3. – BACB & Lightcast. US Employment Demand for Behavior Analysts: 2010–2025. February 2026. Reported by Behavioral Health Business. https://bhbusiness.com/2026/02/17/demand-for-bcbas-continues-exponential-growth-despite-slight-slowdown/
4. – Behavioral Health Business. “Demand for BCBAs Vastly Outstrips the Total Workforce.” March 2024. https://bhbusiness.com/2024/03/25/demand-for-bcbas-vastly-outstrips-the-total-workforce/
5. – California Legislature. Senate Bill No. 946 (Steinberg). Approved October 9, 2011. https://leginfo.legislature.ca.gov/faces/billNavClient.xhtml?bill_id=201120120SB946
6. – California Department of Insurance. CDI Action to Secure Insurance Coverage for Autism. https://www.insurance.ca.gov/01-consumers/110-health/60-resources/05-autism/
7. – California Legislative Analyst’s Office. The 2024-25 California Spending Plan: Human Services. 2024. https://lao.ca.gov/Publications/Report/4933/1
8. – Stax Inc. Autism & Applied Behavioral Analysis (ABA) Therapy Market Overview. February 2026. https://www.stax.com/insights/autism-applied-behavioral-analysis-aba-therapy-overview
9. – California Legislative Analyst’s Office. Proposition 35 Analysis. 2024. https://lao.ca.gov/BallotAnalysis/Proposition?number=35&year=2024
10. – California Legislative Analyst’s Office. The 2025-26 California Spending Plan: Health. 2025. https://lao.ca.gov/Publications/Report/5075
11. – Disability Rights California. Access to ABA Therapy. 2025. https://www.disabilityrightsca.org/publications/access-to-aba-therapy
12. – DHCS. Medi-Cal Targeted Provider Rate Increases. 2024. https://www.dhcs.ca.gov/Pages/Medi-Cal-Targeted-Provider-Rate-Increases.aspx
13. – Cube Therapy Billing. Behavioral Health Treatment Billing Services in California. February 2026. https://www.cubetherapybilling.com/behavioral-health-treatment-billing-services-in-california
14. – National Council on Severe Autism. “California’s Autism Population Soars to New Heights.” July 2025. https://www.ncsautism.org/blog//californias-autism-population-soars-to-new-heights-hits-alarming-milestones
15. – Theralytics. Medi-Cal Enrollment Changes for ABA Providers in California. October 2025. https://www.theralytics.net/blogs/medi-cal-enrollment-changes
16. – TYGES Healthcare. Applied Behavioral Analysis Care Deserts in the U.S. February 2026. https://tyges.com/healthcare-practice/behavioral-health-care-deserts/
17. – California Budget Center. Understanding Proposition 35. December 2024. https://calbudgetcenter.org/resources/understanding-proposition-35/
18. – Cube Therapy Billing. California Autism Coverage Rules Explained. February 2026. https://www.cubetherapybilling.com/california-autism-coverage-rules
19. – O’Sharkey K, Mitra S, Paik SA, et al. Trends in the Prevalence of Autism Spectrum Disorder in California: Disparities by Sociodemographic Factors and Region Between 1990–2018. J Autism Dev Disord. 2025;55(7):2503–2511. doi:10.1007/s10803-024-06371-w
20. – California Health & Human Services Agency. Master Plan for Developmental Services. March 2025. https://www.chhs.ca.gov/blog/2025/03/28/for-the-community-with-the-community-master-plan-for-the-future-of-californias-developmental-services-released/