The Structural Conflict
WASHINGTON, D.C. — The payment model that governs most Medicaid behavioral health in the United States contains a structural incentive to limit access to the most expensive service it covers. Under capitation, a Medicaid managed care organization receives a fixed per-member-per-month payment for each enrollee. That payment is set by actuarial calculation and is intended to cover the full cost of services the enrollee may need. Every service the MCO delivers reduces its margin. Every service it avoids or delays increases it. For most categories of healthcare, this incentive is moderated by the relatively low probability that any individual enrollee will need expensive treatment in a given month. For ABA therapy, that moderation does not exist.
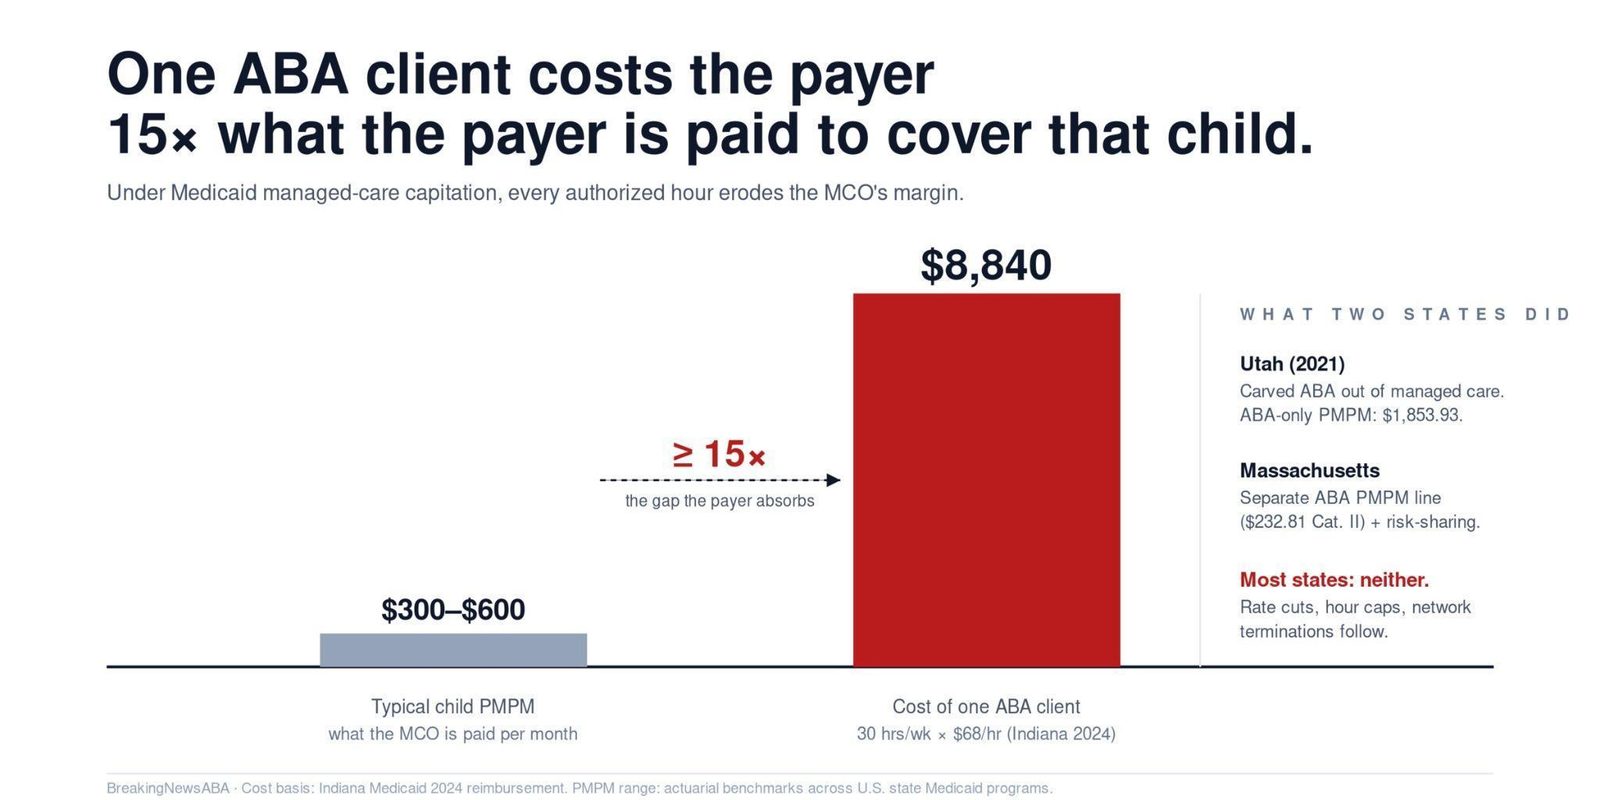
A child with autism receiving comprehensive ABA therapy typically requires 20 to 40 hours per week of direct treatment, delivered by a behavior technician under the supervision of a BCBA. At Indiana’s 2024 Medicaid reimbursement rate of approximately $68 per hour, a child receiving 30 hours per week generates a cost of $2,040 per week, or approximately $8,840 per month. The typical Medicaid per-member-per-month capitation rate for a child ranges from approximately $300 to $600 in most states, depending on the rating category and the actuarial assumptions underlying the rate. The cost of a single ABA client can exceed the capitation payment for that child’s entire enrollment category by a factor of 15 or more. Under capitation, a child with autism who receives comprehensive ABA is, from the MCO’s financial perspective, a loss on every dollar the MCO spends above the capitation rate.
This is the structural conflict at the center of Arizona’s ABA access crisis. Attorneys representing affected families argued, in reporting by the Arizona Mirror in March 2026, that the more therapy a plan’s enrollees receive, the less of the capitation payment the plan keeps, and that ABA is among the most expensive services a plan covers. That argument is not an accusation of bad faith against any individual organization. It is a description of how the incentive structure works. When an MCO receives a fixed payment and must cover a service that costs 15 times that payment for a subset of enrollees, the financial pressure runs in one direction: cut provider rates, shorten authorizations, tighten documentation requirements, narrow the provider network, or terminate high-cost contracts. The cost-containment actions taken across state Medicaid programs in 2025 and 2026 are consistent with this incentive.
A child receiving 30 hours per week of ABA at $68 per hour costs the MCO approximately $8,840 per month. The typical Medicaid PMPM for a child is $300 to $600. The cost of a single ABA client can exceed the capitation payment by a factor of 15 or more.
The State That Said It Doesn’t Work

Utah provides the clearest evidence that the capitation model is structurally incompatible with ABA. In a 2021 report to the state’s Social Services Appropriations Subcommittee, the Utah Division of Medicaid and Health Financing disclosed that it had carved ABA services out of its managed care Accountable Care Organization contracts and kept them on a fee-for-service payment methodology. The reason: the state “determined it did not have sufficient claims and reimbursement history to establish monthly per member per month estimates to allow coverage under a managed care arrangement.” The state reported that the approximately 1,150 Medicaid members receiving ABA generated a per-member-per-month cost of $1,853.93, or approximately $22,247 per year. That PMPM was too volatile and too high to fold into a capitated rate without either dramatically underpaying the MCO or dramatically overpaying it, depending on how many ABA-eligible members enrolled in a given month.

Massachusetts took a different approach but arrived at a similar conclusion: ABA cannot be treated as a generic behavioral health service within a capitated contract. MassHealth’s managed behavioral health vendor contract separates ABA into its own per-member-per-month line item, distinct from the medical services PMPM and the substance use disorder PMPM. For Rating Category II children, the highest-need group, the ABA-specific PMPM is $232.81 per month, on top of a $428.78 medical services PMPM. The contract also includes risk-sharing provisions that reconcile ABA and SUD spending after the contract year, acknowledging that the cost of these services is difficult to predict with the actuarial precision that capitation requires. Both the Utah carve-out and the Massachusetts risk-sharing mechanism reflect the same underlying recognition: ABA’s cost profile does not fit the capitation model without structural adjustment.
The National Pattern
Most states have not made the structural adjustments that Utah and Massachusetts have. Instead, they have left ABA inside capitated managed care contracts and are now experiencing the predictable consequences. In Arizona, a Medicaid managed care contractor terminated contracts with two of the state’s largest ABA providers; a lawsuit filed by one of those providers alleges the termination followed demands for rate cuts of 15% and then 25%. The plan has said in court filings that its remaining network has the capacity to absorb the affected children, a claim the litigation disputes. In Nebraska, the state cut technician-level ABA reimbursement by 48%, from approximately $144 to $74.80 per hour. In Indiana, the state imposed a 4,000-hour lifetime cap on comprehensive ABA, a 30-hour weekly maximum, and an age-21 cutoff. In Vermont, the state eliminated concurrent BCBA-technician billing, causing what VTDigger described as “a drastic drop in revenue” for approximately 20 ABA providers.
Each of these actions is a different mechanism for solving the same problem: the cost of ABA within a capitated or budget-constrained environment exceeds what the payment structure was designed to support. Rate cuts reduce the per-unit cost. Hour caps limit the total volume. Documentation tightening increases the denial rate, reducing the number of paid claims. Network narrowing limits the number of providers available to deliver care. Contract terminations eliminate the highest-cost providers from the network entirely. All of these mechanisms reduce the MCO’s ABA spending. None of them address the underlying structural conflict between capitation and the cost of intensive, long-duration, high-frequency therapy.
The spending data illustrates the scale of the problem. Minnesota’s autism therapy spending (EIDBI) surged from approximately $671,000 in 2018 to $342.8 million in 2024, with average spending per recipient rising from $1,678 to over $60,000. Indiana’s spending grew from $21 million in 2017 to $611 million in 2023. North Carolina’s grew from $1.9 million in 2020 to $505 million in 2025 with an average cost of approximately $37,600 per patient. When spending growth of this magnitude hits a capitated system, the MCO has two choices: absorb the losses or reduce the spending. The rate cuts, hour caps, and contract terminations that have defined the ABA landscape in 2025 and 2026 are the second choice playing out in real time.
Utah carved ABA out of managed care entirely because the per-member cost of $1,853.93 per month was too volatile for capitation. Massachusetts created a separate ABA PMPM line with risk-sharing provisions. Most states have done neither, and the consequences are now visible in every access metric.
What This Means for Providers and Families
For ABA providers, the capitation incentive structure means that the MCO is not a neutral intermediary. It is a counterparty with a financial interest in reducing ABA spending. Every authorization request, every rate negotiation, and every network adequacy assessment occurs within this incentive structure. Providers who understand this dynamic can negotiate more effectively, diversify their payer mix to reduce dependence on any single MCO, and advocate at the state level for structural adjustments like carve-outs or risk corridors that align the payment model with the cost of care. Providers who do not understand it will experience rate cuts, shortened authorizations, and network terminations as arbitrary or punitive decisions, when they are in fact the predictable outputs of a system that pays a fixed amount for a variable-cost service.
For families, the implication is that the provider directory and the network adequacy claim are outputs of the same incentive structure. Attorneys in Arizona class-action litigation have alleged that some plans maintain “ghost networks”: directories that list providers who have no openings, do not accept Medicaid, or cannot deliver the services families need. Plans and state officials dispute that characterization in court filings, and the litigation remains unresolved. But the incentive analysis explains why the dispute keeps recurring: capitation rewards a network that is adequate on paper while constraining the volume of care the plan actually pays for. The families who rallied at the Arizona Capitol on March 5, 2026, were protesting the consequences of a payment model they were never told about and had no ability to influence. Until states either carve ABA out of capitation, build ABA-specific risk corridors into their MCO contracts, or transition to value-based models that reward outcomes rather than penalizing service volume, the structural conflict will persist, and the access gaps will follow.
AT A GLANCE
| ABA monthly cost: | Comprehensive ABA (30 hrs/week at $68/hr) = ~$8,840/month per child; typical PMPM: $300-$600 |
| Cost multiple: | ABA cost can exceed child PMPM by 15x or more under capitation |
| Utah carve-out: | ABA carved out of managed care; kept on fee-for-service; ABA PMPM: $1,853.93 (~$22,247/year) |
| Massachusetts: | Separate ABA PMPM line ($232.81 for Category II children) + risk-sharing provisions for ABA/SUD |
| Indiana trajectory: | $21M (2017) to $611M (2023); $474M after rate reform (2024); projected $645M (2026) |
| Minnesota: | $671K (2018) to $342.8M (2024); 50,000%+ increase; average per-recipient: $1,678 to $60,000+ |
| North Carolina: | $1.9M (2020) to $505M (2025); projected $1B by 2027; average: ~$37,600 per patient |
| Arizona: | AHCCCS ABA spending $260M (FY2024) to $371M (FY2025); 43% increase; provider litigation alleges contractor rate cuts of 15% then 25% |
| Nebraska: | 48% rate cut for technician ABA ($144 to $74.80/hr) |
| Incentive structure: | Fixed PMPM + variable ABA cost = MCO incentive to narrow networks, shorten authorizations, terminate contracts |
| OIG audits: | Estimated improper payments per HHS-OIG audits: IN $56.5M; ME $45.6M; CO $77.8M (audit findings, not fraud determinations) |
| The core incentive: | Each additional hour of therapy reduces plan margin; ABA is among the most expensive services in the child benefit |
SOURCES & REFERENCES